


Graduate school applicants must take the GMAT exam as part of the application process. The Graduate Management Admission Test (GMAT) is an adaptive test whose objective is to evaluate a candidate’s cognitive and analytical abilities. Being a standardised exam, a GMAT score allows graduate schools to compare applications from arriving from all over the world and make an informed decision to find the right candidate. International institutions use the total GMAT score that is generated using the GMAT score chart as part of the application process.
There are various ways to understand the GMAT exam results on the official score report. On the official GMAT score report, each of the five GMAT exam scores is presented on a fixed scale.
Did you know that our study abroad specialists provide a comprehensive range of test preparation services, including GMAT preparation? Reap the benefits of our services right away to master the GMAT!
Get a Personalised Study Plan to Score a Perfect 800 on GMAT!
What is a GMAT Score Chart?
Students can use the GMAT Score Chart to see how the scaled scores they have received on the Quantitative and Verbal Reasoning sections relate to the overall score. As they have no bearing on the overall GMAT score, the Integrated Reasoning (IR) and Analytical Writing Assessment (AWA) scores are not represented in the GMAT score chart.
The GMAT score chart allows candidates to assess how their performance compares to that of other test-takers. Applicants can better comprehend their GMAT score, percentiles, and areas where they need to improve by using the GMAT score chart.
Here is a helpful GMAT score chart that you may check to see more clearly how to translate the 0-60 sectional scores into an overall 200-800 point score. Consider this to be your grid for the actual GMAT exam:
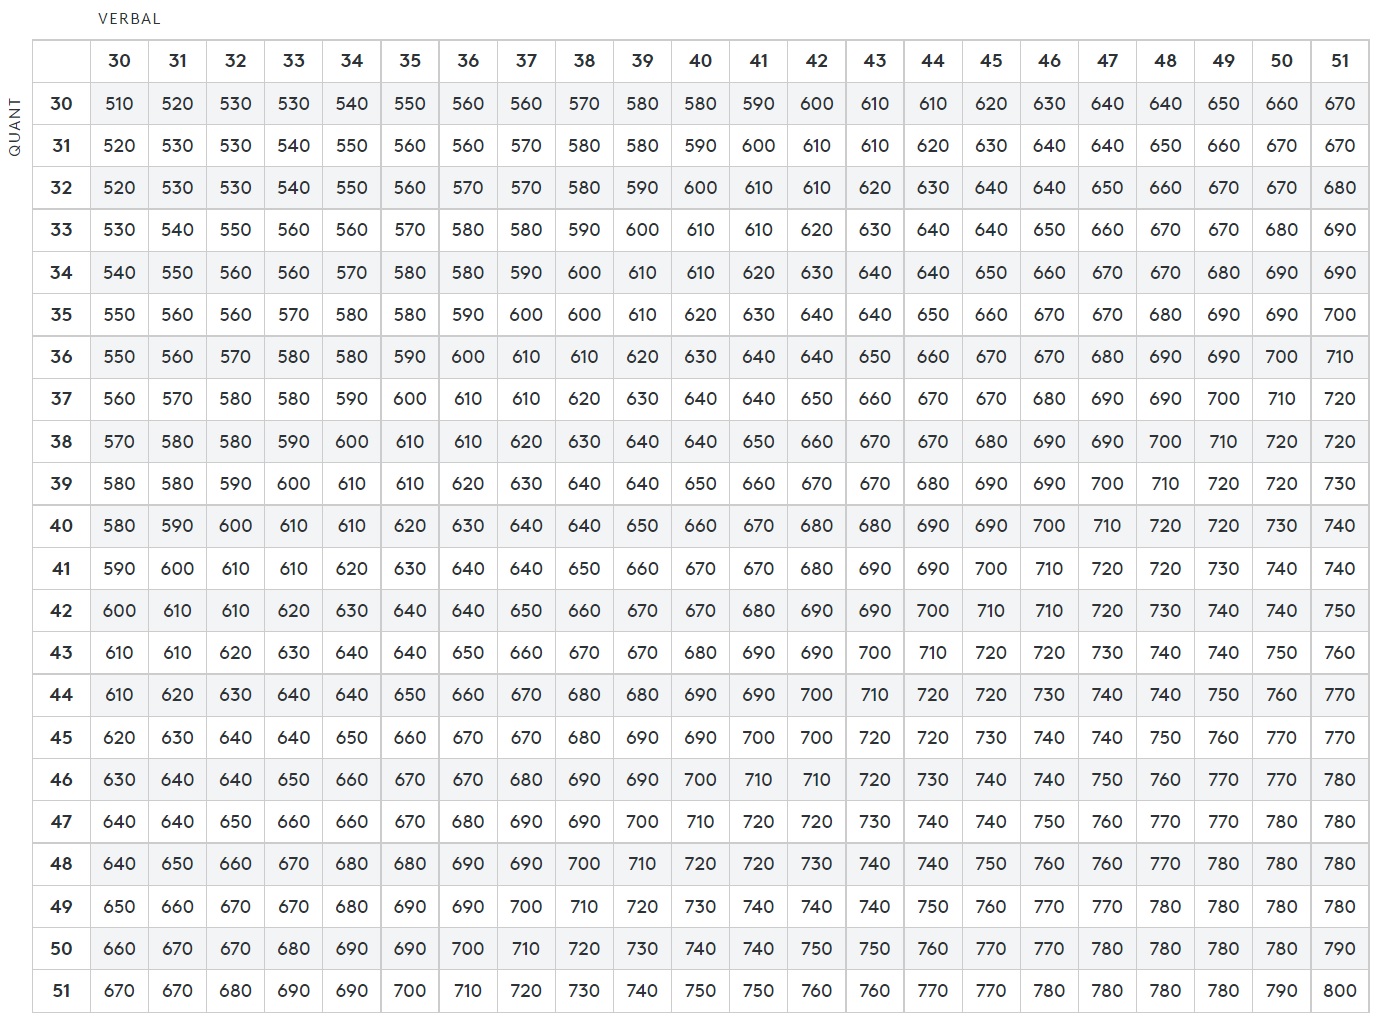
The results from the Integrated Reasoning or the Analytical Writing Assessment (AWA) section are not required for this as this GMAT score chart demonstrates how to calculate the multiple-choice score only.
You can easily comprehend how your scaled verbal and quantitative scores relate to your overall score by using the GMAT score chart. In order to achieve your goal GMAT score on the 800-point scale, you may determine how much you need to improve your GMAT performance in each section.
How Can I Read the GMAT Score Chart?
You can use the table given above to check the minimum score requirements for each part and target your desired score. For instance, separate Verbal and Quantitative scores can be combined to give you an overall score of 700. Determine which section is your strength and which section requires more practice so that you can plan to achieve a high overall score accordingly.
Given the nature of tests on curves, a score of 670 representing the 90th percentile indicates that 89% of test-takers will not get this score. The results of your calculations are simply a rough guide to showcase where you may stand in the actual GMAT exam. The composite score you receive on the final GMAT test may differ by +/- 40 or +/- 50 points from what you see here. This does not imply that the identical Quant and Verbal raw results will result in a different combination of scores.
However, as GMAT test-takers tend to perform better on the Quant part, focus on raising your score there to achieve the highest overall score possible. Verbal section scores also contribute slightly more to the total score.
How are the GMAT Sections Scored?
You may be allured to pay attention only to your total GMAT score, but you must also keep in mind that the other scores are also important. These section-wise scores provide information about your strengths and areas for improvement to the institutions that receive your GMAT scores:
|
GMAT Section |
GMAT Scoring |
|---|---|
|
6-51 |
|
|
1-8 |
|
|
0.0-6.0 |
|
|
Total GMAT Score |
200-800 |
How Different GMAT Sections are Scored?
Check out each section is scored and figure out your strengths and weaknesses:
Quantitative Reasoning and Verbal Reasoning
There are item-level adaptive sections for Quantitative and Verbal Reasoning, with your score based on three factors:
-
The number of questions you have answered
-
How accurate are the answers
-
The difficulty level of the questions you answered and other parameters.
If you successfully answer more questions and are eligible for questions of greater difficulty, your score will increase. The standard error of measurement is 3 points, and scores are provided in 1-point increments
Integrated Reasoning
The number of questions you successfully answered determines your Integrated Reasoning score. You must correctly respond to every section of a question to gain credit for it. Some questions may have numerous parts. Scores are presented in 1-point increments.
Analytical Writing Assessment
Professional essay raters and a computer algorithm are used to score essays. The score is displayed in 0.5 intervals.
Total GMAT Score
Before scores for the Quantitative and Verbal Reasoning parts are announced, your calculated performance is used to determine your total score. The final step is to transform the raw calculation into a value in the Total Score range. Scores are shown in 10-point intervals. The measurement's standard error ranges from 30 to 40 points.
How Do the Same Quant and Verbal Scores Lead to Different Total Scores?
Consider the following example to have a better idea of how various components of the GMAT scoring system work together to produce a set of scores:
A test-taker receives a Q48 for their performance in the Quantitative section and a V40 in the Verbal section. The scores of Q48 and V40, which could represent a range of performance levels, are not used by the computer to demonstrate the ‘Total Score’ (200-800). Instead, the computer uses the test takers' actual performance on the verbal and quantitative section questions.
The candidate may have received a Q48 with 24 accurate answers in the quantitative section and a V40 with 30 correct answers in the verbal section. Their total score would most likely be 720 if they got 30 verbal questions right and 24 quantitative questions right.
Alternately, the test-taker might achieve the identical section scores of Q48/V40 by answering 23 of the verbal and 28 of the quantitative questions correctly. In such a situation, their ‘Total Score’, which might be 710, would be based on 23 questions correctly answered in Quant and 28 questions correctly answered in Verbal.
In spite of answering a different number of questions correctly, the test-taker would still receive the same section scores. The test-takers ‘Total Score’ may also fluctuate even while their section scores stay the same. Such situations are plausible given that a GMAT score represents a range of performance and takes into account both the number of questions answered correctly and the complexity of those questions.
One of the many techniques universities use to compare applicants and assess their likelihood of academic success is GMAT scores. A prospective graduate student's test scores are converted into a GMAT score using the GMAT score chart. In order for colleges and test takers to compare their scores to those of other test-takers, the chart also includes GMAT percentile rankings that further help the admissions committee make an admission decision. An applicant's test results remain the same when the score table is refreshed each summer, but their percentile ranking may increase or decrease.
Wish to ace your GMAT exam to apply to top B-schools abroad? Write to us at abroad@collegedekho.com to get in touch with our study abroad expert team to resolve all your queries.
Wish to Apply to Top B-Schools Abroad?


