IELTS Task 1 - Line Charts and Graphs: Find Samples and How to Answer Here

  • Mode

    Both

vector vector vector vector vector
Samarpita Goswami logo

Samarpita Goswami
Updated on Apr 06, 2023 7:01 PM IST

Preparing for the IELTS exam this year? What better way to start than by learning how to answer IELTS task 1, which involves questions and tasks surrounding Lines, Charts and Graphs. Compiled on this page is all the relevant information regarding IELTS Task 1: Lines, Charts and Graphs that you may need to achieve the perfect score.

Go through this page to understand what IELTS Task 1: Lines, Charts and Graphs is all about and how you can attempt it effectively to achieve the best score possible. You will find the step-wise method to answer the questions with infographic details, as well as the tips and tricks to keep in mind when answering such questions in the IELTS exam this year.

IELTS Task 1: Line Charts and Graphs

The two types of IELTS exams are IELTS Academic and IELTS General Training, both of which have two tasks allotted for the writing section. In the IELTS writing task, candidates have to decipher the meaning of the information given and write an appropriate description of the same within a given word limit. Both tasks are important and extensive, and candidates have to apply their analytical and conversational skills. 

IELTS writing task 1 provides pictorial representations of information such as line charts, bar graphs or pie charts. In this task, one has to study a line chart or graph and represent the information in words or written text. The candidate will have to describe writing task 1 in 150 words.

IELTS Task 1 line charts and line graph task 1 is a very important part of the test as candidates have enough time to attempt the test but will have to utilise it effectively. One-third of the total time of the writing task is dedicated to this section. 

IELTS writing task 1 is of 60 minutes and candidates will require 20 minutes to complete the task as it is 150 words in comparison to the IELTS writing task 2 which is of 40 minutes. 

This page will guide you to understanding the IELTS Task 1 Line Charts and Graphs and IELTS Pie Chart task 1 and also get to know how to solve the questions. Additionally, samples and answers have been provided for easy reference.

Related Links:

IELTS Bar Graph

Important Vocabulary IELTS

Connectors for IELTS Writing Task 2

IELTS Essay Writing Samples

IELTS Map Vocabulary

IELTS Advantage and Disadvantage Essays

IELTS Discussion Essay Topics

IELTS Essay Topics

Common Spelling Mistakes in IELTS Writing

All About IELTS Writing Section

What are Line Charts and Graphs?

Line Graph Task 1 and Bar Graph Task 1 are pictographic representations of certain information. 

When different fields and parameters are related to each other by one common factor. They can be represented in a single representation. Often several factors are the basis of comparison and are used to observe, derive and understand the information that various parameters represent.

The questions asked often show trends, intensity and interrelation between two variables. 

Line Charts: IELTS line charts present information in continuous lines while connecting the highlighted points and representing certain trends.

Bar Graphs: IELTS bar graphs present information in form of a rectangular projection while showing the contribution of the x-axis and y-axis parameters. They represent intensity and quantity.

Pie Chart or Graph: A pie chart in IELTS is a type of graph which presents the percentage share of a variable as a part of the whole one. In the picture, it is represented as a whole circle or wheels divided into different proportions.

Get FREE Consultation to Study Abroad!

Highlights of IELTS Lines Charts and Graphs

Here is a summary of features of IELTS Writing Task 1 Line Charts and Graphs:

Parameters

Description

Duration

20 minutes

Section

Writing section

Marks Allotted

Proportionate and qualitative

Skills Tested

Ability to select and report main features

Ability to describe and compare data

Ability to identify significance and trends in data

Ability to describe a pictorial representation in words

Steps to Attempt IELTS Lines Charts and Graphs

While 20 minutes are good enough to attempt IELTS Writing Task 1, it is not enough if in absence of proper time management. It is observed that lack of planning often leads to candidates performing their writing Task 1 poorly.

Here, we have the steps which the candidates can adopt to properly attempt IELTS writing Task 1 academic. The rules here are given forLine Graph Task 1, Bar Graph Task 1 and Table Graph Task 1:

Step 1: Grasp the Gist of the Question (1-1.5 minutes)

The very first step for the test takers is to understand the gist of the question of the IELTS writing task 1. Here, gist means what the graph or chart is representing, such as comparison, shares, growth, or any other trend. Often in pictorial representations, the common parameters determine the gist of the question. For instance, If the common parameter is the year, then there are two factors that are being compared on their yearly performances.

Once the gist of the question is clear, it becomes a lot easier for the candidate to further inspect the question.

The pro tip for IELTS task 1 here is that the gist or common factor is often represented on the y-axis or x-axis in the line graph Task 1.

In the case of a pie chart IELTS and bar graph IELTS, finding the gist is fairly easier, as it is based on finding the factor which is the whole one.

Step 2: Identify the Main Features of the Question (1 -1.5 minutes)

After understanding the gist of the question, the candidate needs to identify all the features involved in the line graph IELTS presented. These features include all the information presented, including the fields and units, the number of parameters represented, the subject they are related to, the trend showcased, etc.

Identifying the features and gist shall take the candidate almost 2-3 minutes, at the end of which they will find themselves to have simplified the question by a good measure.

Step 3: Identify the Interrelationship of the Features (1-2 minutes)

Once the candidate has identified the gist and features of IELTS writing task 1, they need to identify and work out the interrelationship showcased by the graph or line chart.

The interrelationship is the representation that is intended by the task 1 bar graph or line chart. It might seem like the gist but it is much more. The gist is the summary of the pictorial representation, but interrelationship is the purpose for which a bar graph task 1 or line graph IELTS has been designed.

Although the purpose is often contextual and IELTS exam 2023 candidates shall only have a graph or chart, and possibly a very short outline of information, they can still work out a rough and most probable purpose of the graph.

If the candidate has already worked out the first two steps well then figuring out the interrelationship will only take them 1-2 minutes.

On completion of the first three steps, the candidates shall find themselves that they have decoded their IELTS Task 1 to its full. They know and have grasped all the information presented, and now only have to relay it, while only 4-5 minutes have passed since beginning their writing task 1 academic test.

Step 4: Draw an Outline (2-3 minutes)

As candidates must have observed that the steps are simple and practical, but organising them has made the process simpler and more speedy. Similarly, we can organise the writing steps as well of IELTS task 1.

First of all, candidates need to draw an outline of their IELTS writing task 1. This outline refers to the structure, that is an introduction, the body, and the conclusion.

While the introduction and conclusion are self-explanatory, we suggest that candidates create a structure of task 1 bar graph or table chart task 1 or pie chart IELTS to ensure that they do not forget or repeat the information in the body text.

In the body, candidates can bifurcate their information on the basis of the structure. First, they give an overall explanation, then explain the features and draw interrelationships, and finally, give an in-depth insight into the representation of the graph or line chart.

Since every aspect of information has already been understood the process shall take at most 3-4 minutes for the candidate.

Step 5: Add Description (7-10 minutes)

Once the outline is complete, the next step is to put everything in words. Here, the information is still in focus, but since we have grown quite familiar with it, the candidate is advised to take care of the vocabulary and flow of the text while IELTS writing task 1.

By the time the candidates are done with these steps, they shall notice that they only have had to attribute about 15-17 minutes of their time. Yet, they will find themselves more confident and sure of what they have done before.

Step 6: Revise (2-3 minutes)

Lastly, candidates are advised to revise their text and all the other findings. They can divide this into three sub-steps as well:

  1. Check the facts and information by comparing the text and their own findings of Steps 1-3.

  2. Check the grammar, spelling, and punctuation of the written text.

  3. Check vocabulary, text flow, and representation made by the text.

When the answer to IELTS writing task 1 is ready, candidates can check if it includes all the prioritised information.

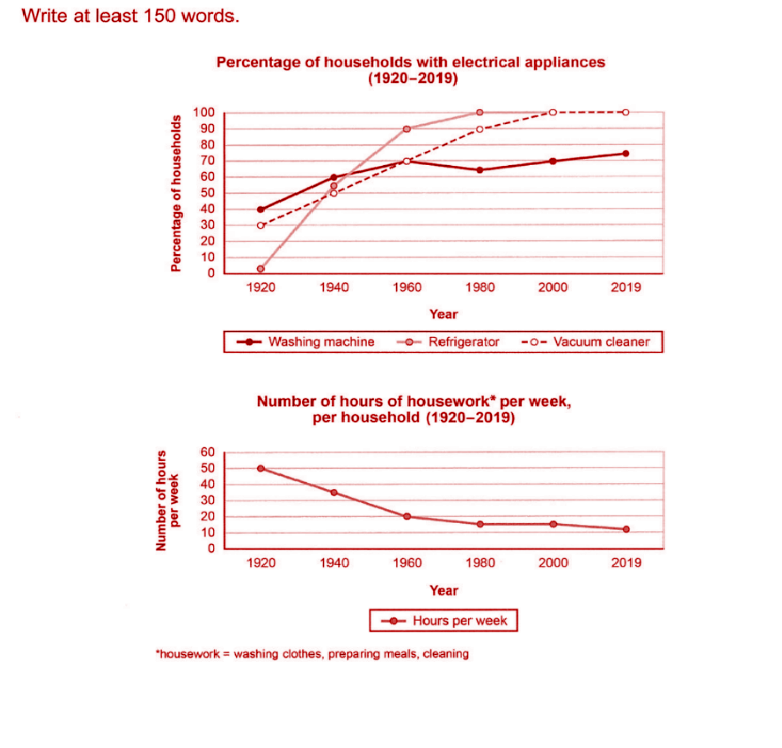
IELTS Task 1 Line Charts and Graphs Samples

Sample 1

IELTS Task 1 Line Charts and Graphs Sample 1

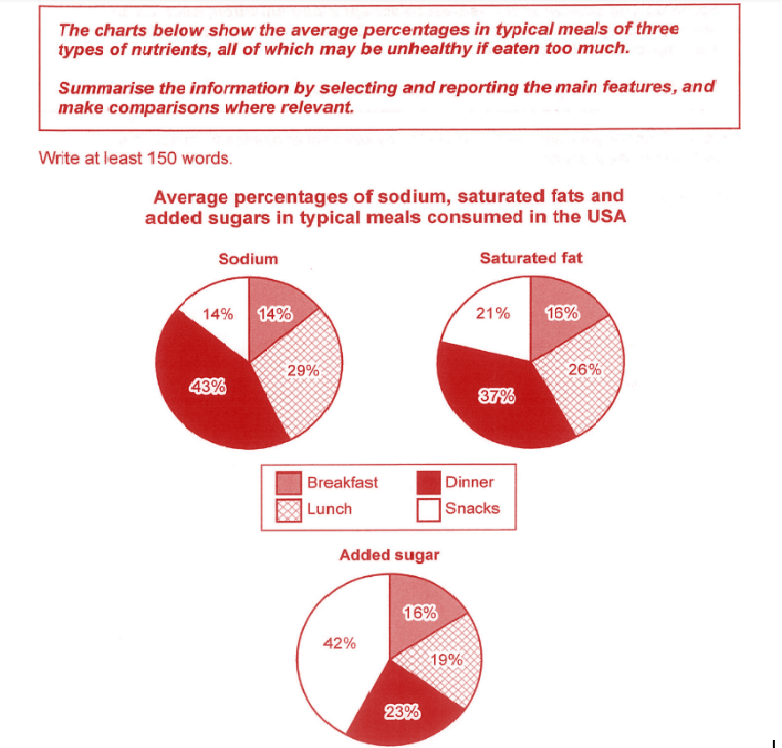
Sample 2

IELTS Task 1 Line Charts and Graphs Sample 2


Sample 3

IELTS Task 1 Line Charts and Graphs Sample 3


Tips for IELTS Task 1 Line Charts and Graphs

The following tips will come in handy to the candidates appearing for IELTS 2023 when solving IELTS Task 1 Line Charts and task 1 bar graphs questions:

  • There is no upper limit mentioned for the number of words. Hence, the candidates have to write at least 150 words, but they also need to control their word count, or they will end up wasting time on one section only. The recommended word count for IELTS Task 1 Line Charts and Graphs is 175-200 words.

  • Prioritise the information provided in IELTS general writing task 1 or writing task 1 academic that is required to be put into writing. Since the word limit is less and the description could expand a lot based on the student’s understanding, they should prioritise their information. 

  • Ensure all the information is correct and direct. Since the word limit is only 150 words, the symbolism and other facets of information must not be included. Direct, concise, clear, and to-the-point information must be relayed.

  • Avoid spending more than 22 minutes on IELTS Writing Task 1, as Task 2 is more extensive and does not help the candidate with extended information support.

  • Candidates are advised to keep all their steps crisp as the final information is not much longer and thorough understanding and clarity are the main things that are required rather than in-depth representations.

As we reach our conclusion, we assure our readers that all the possible points required to solve the IELTS Task 1 line charts and task 1 bar graphs have been provided in this guide.

However, at the same time, we bring to their attention that IELTS Writing Task 1 is not always necessarily line charts or graphs, it also includes processes, cycles, hierarchy, etc. 

IELTS Task 1 of the IELTS writing section is based on diagrammatic or pictorial representation and it aims to test the analytical, understanding, and information comprehension skills of the candidate.

As there is no surety of the type of diagram, whether it will be line graph task 1, bar graph task 1 or pie chart task 1 that could be asked we suggest that students practise all types of questions, and understand how to approach them.

Related Links:

How to get 8 Bands in IELTS?

Benefits of IELTS Coaching

How to Crack IELTS in the First Attempt?

Common Mistakes While Preparing for IELTS

How to Prepare for IELTS in a Month?

How much Time is Required to Prepare for IELTS?

IELTS Pie Chart Task 1

In the IELTS Academic writing section, candidates are supposed to write a short visual description of the information or data provided. One of the ways to present data is pie chart task 1. 

The pie chart IELTS is a circular chart divided into sectors known as pie slices usually illustrating percentages of a given data. The size of pie slices depends on the relative quantity of data it represents. Together the data of the slices create a full circle. 

In pie chart task 1, test-takers will be presented with one or more pie charts. Their task is to describe the information gathered from the pie chart IELTS to write in a report of 150 words. Candidates should remember that they are not supposed to give their opinion on this type of question. 20 minutes of time is allotted for the pie chart task 1 or IELTS task 1.

The purpose of IELTS pie chart task 1 is to test the candidate’s ability to:

  • Give an objective description of some graphic information.

  • Compare and contrast the data given in the pie charts.

  • Report an impersonal topic or statistical data with the use of opinion.

  • Use the language of graph description.

How to Answer an IELTS Pie Chart Task 1?

The IELTS writing section contains a pie chart task 1 which is to be answered appropriately and to the point. Here are some guidelines to answer pie chart IELTS:

  • It should have a proper introduction, body and conclusion.

  • There should be connecting words to make cohesive sentences and paragraphs.

  • It should contain a variety of sentence structures and appropriate vocabulary.

  • It should be within the word limit.

  • It should describe the graph adequately.

Students should use two opening sentences to introduce the pie chart task 1. Sentence 1 should define the pie chart. In case of comparison, it should be written as the “pie chart compares”.

The second sentence should describe the trend and the body should contain a detailed description. The report must be concluded with one or two sentences that draw the relevant conclusion to IELTS writing task 1.

Study at Top Universities Abroad by Registering With Us!

FAQs on IELTS Task 1: Line Charts and Graphs

Which section asks IELTS Task 1 Line Charts and Graphs questions?

IELTS Task 1 Line Charts and Graphs questions are asked in the Writing section of the IELTS exam. The writing section of the IELTS exam consists of two tasks, each of which requires the candidate to write a descriptive text on the information provided in the question. IELTS Writing Task 1 provides line charts and graphs which have to be described.

What score is dedicated to IELTS Task 1 Line Charts and Graphs?

There is no dedicated score for IELTS Task 1 Line Charts and Graphs. Each IELTS section is marked on the basis of the test-taker’s performance in 0-9 bands. Marks for IELTS Task 1 are awarded on the basis of their written text, points covered, the vocabulary used, word count of the text, the structure of the presentation, etc.

Does IELTS Task 1 Line Charts and Graphs involve descriptive writing?

Yes, IELTS Task 1 Line Charts and Graphs involve descriptive writing. The task is a requirement for test-takers under the writing section, where all questions demand descriptive answers. Candidates have to write a short text of at least 150 words describing the features and information presented by the line charts and graphs given. 

What common mistakes must be avoided while attempting IELTS Task 1 Line Charts and Graphs?

The common mistakes which must be avoided while attempting IELTS Task 1 line Charts and Graphs are related to non-clarity and over-indulgence in the text. Test-takers must avoid trying to include everything in the text as it is a short-form text. The answer should be precise and to the point.

What is the time limit to attempt IELTS Task 1 Line Charts and Graphs?

There is no time limit mentioned to attempt IELTS Task 1 Line Charts and Graphs. However, the whole writing section is allotted 60 minutes, within which IELTS Task 1 demands an answer with at least 150  words and IELTS Task 2 requires at least 250 words. On the basis of word count requirements, British Council advises IELTS candidates to spend at least 20 minutes solving Writing Task 1.

Does handwriting matter in IELTS Task 1 Line Charts and Graphs?

Yes, handwriting matters in IELTS Task 1 Line Charts and Graphs. IELTS Task 1 is a part of the writing section. On a paper-based test, the test-takers are required to attempt the question manually. It is important that what they write is clear and legible to the examiner. Or else, however well organised their text is, difficulty in reading faced by the examiner would lead to a lower IELTS band score.

How many paragraphs need to be written in IELTS Task 1 Line Charts and Graphs?

Three paragraphs need to be written in IELTS Task 1 Line Charts and Graphs. Though this requirement is not expressed by the British Council, test-takers are advised to keep the introduction and conclusion separate from the main text. Since the word limit is at least 150 words, the two bifurcations will help in organising the content and presentation of the text.

How many words need to be written in IELTS Task 1 Line Charts and Graphs?

At least 150 words need to be written in IELTS Task 1 Line Charts and Graphs. There is no upper word limit set by the British Council for test-takers, but they require the Task 1 answer to have at least 150 words. The limit has been set according to the section’s duration and the number of words required to explain the given line charts and graphs.

Which is the best way to attempt IELTS Task 1 Line Charts and Graphs?

The best way to attempt IELTS Task 1 Line Charts and Graphs is by organising the question-solving process into steps. These steps must include understanding the given line chart and graph first, then forming an outline of the answer, and finally describing the thoughts in detailed text. The steps will help in maintaining clarity and covering of main points.

Is it compulsory to attempt IELTS Task 1 Line Charts and Graphs first?

It is not compulsory to attempt IELTS Task 1 Line Charts and Graphs first. There are a total of two tasks asked in the writing section of the IELTS exam. Test-takers can attempt whichever task suits them first. However, it is strongly recommended that Task 1 is attempted first, as information is available and only has to be described, while Task 2 requires an extensive thought process.

Is IELTS Task 1 Line Charts and Graphs connected to IELTS Task 2?

No, IELTS Task 1, Line Charts and Graphs, is not connected to IELTS Task 2. Although both tasks require the test-taker to attempt text writing, the two questions are not based on each other. There may be a contextual similarity, however, the two tasks are never interdependent on each other.

View More

Colleges accepting IELTS

Preparing for IELTS?

Interested in Studying Overseas?

Connect with us and kickstart your learning journey for a rewarding experience!

By proceeding ahead you expressly agree to the CollegeDekhoAbroad Terms of Use & Privacy Policy.